Heavy Machinery and Earth Moving Equipment
Framework capable of communicating with a wide variety of plant and equipment and uses intelligent data mining and analysis to deliver important efficiency and diagnostic information to the user
HVAC Equipment

Pacific Controls is the market leader in monitoring HVAC equipment. Its ICT Enabled Managed Services for Business Process Integration provide flexible web-based tools with powerful data mining and diagnostic capabilities that can achieve this. The service is supported by highly experienced electrical, mechanical and controls engineering experts who are available as required to provide additional support during an incident, for off-line analysis and to provide recommendations for improvement, event analysis and reporting.
Innovative Approach to Building and HVAC Equipment Management

Data logging and equipment registers have become obsolete now that wireless connections over the Internet allow data to be collected automatically. Intelligent data mining transforms unmanageable data logs into rich sources of valuable information to aid decision making. Pacific Controls experience of monitoring and verification has allowed them to capture diagnostic procedures in rule-based artificial intelligence so that no fault goes unnoticed. Incident-based Pacific Controls Managed Services for Critical Assets Monitoring include online performance assessment of large chilled water and district cooling plants and an effective mechanism for maintaining the plant as close to the performance benchmark as possible.
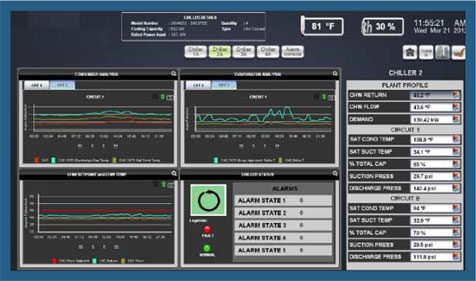
Pacific Controls managed services framework is capable of communicating with a wide variety of plant and equipment and uses intelligent data mining and analysis to deliver important efficiency and diagnostic information to the user. It incorporates the following features:
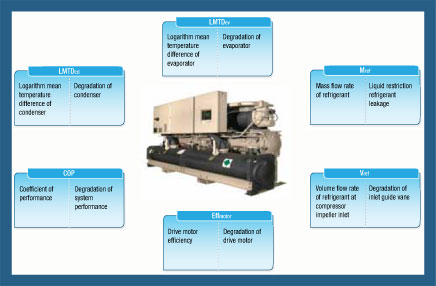
- Grey Box DOE-2 chiller analytical models based on three polynomial curves. They describe how the cooling and performance-based diagnostics mean that every alert and alarm reported will be investigated.

Pacific Controls Managed Services for Critical Assets Monitoring use artificial intelligence to suppress false alarms and ensure that high priority alarms are given the attention they deserve. Performance metrics are monitored and analysed using a matrix approach that allows the whole environment of the building and the requirements of its users to be taken into account. This approach highlights unexpected factors that may be having a surprisingly large effect on performance.
Advanced Chiller Analysis
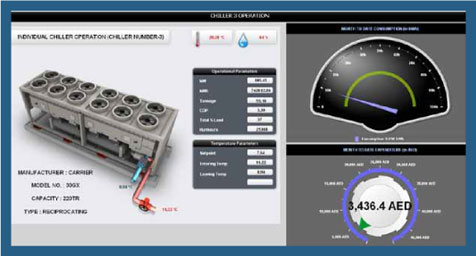
Chilled water-based cooling systems are frequently used to air-condition large office buildings or campuses that encompass multiple buildings. They represent a large investment in terms of initial cost, the physical space they occupy within the building, energy and maintenance expenses. Yet many chiller plants do not reach their potential energy efficiency capacity and efficiency (kW/ton) vary with operating conditions, as well as how the power consumption varies at part load conditions. They are empirical in the sense that the polynomial structure is not based on physical relationships. It is a grey-box model as the final power prediction of the chiller is based on physically meaningful quantities obtained from the polynomial curves. The model assumes that evaporator and condenser water flow rates remain constant
- Integrated Part-Load Value (IPLV) is calculated using the method described in ARI standards 550.590 (2003) Standard Rating Conditions. The IPLV rating requires that the unit efficiency be determined at 100%, 75%, 50% and 25% load conditions. When necessary, efficiencies are determined by plotting the efficiency against the % load using straight-line segments to connect the actual performance points and to determine the 75%, 50%, or 25% load efficiencies
- Drift analysis to identify trends in the process variables and the calculated or derived variables. Other analytical tools such as statistical deviation and regression analysis are also incorporated into the application
- Refrigerant management, which is an important aspect of chiller maintenance as small leaks lead to loss of efficiency as well as raising compliance issues. The managed service includes a time-tested strategy that ensures equipment operates at its maximum efficiency as well as ensuring regulatory compliance and providing refrigerant inventories and chiller-refrigerant conversions.
Analyse Energy Use and CO2 Emissions and Reduce Fuel Bills

Pacific Controls Managed Services for Critical Assets Monitoring include all the tools needed for building energy analysis and minimising fuel bills. These include:
- Energy Analysis - comprehensive analysis of energy data including degree day, base load, regression, electricity analysis and league tables based on different key performance indicators.
- Benchmarking – providing reports based on government or user defined standards.
- CO2 Emissions Reporting and CO2 activity data tracking.
- Financial Analysis - manage supplier contracts, create and monitor budgets and analyse energy in terms of cost.
- Contract Bid Management - for multiple service providers with different tariff rates.
- Supplier Contract Analysis - to determine the best rate based on historical consumption profiles.
- Reporting that is flexible and automatic with text, tabular and graphical report templates that may be run against different companies, sites and meters.
- 24x7 Alarm Management and Reporting - with the support of subject-matter experts (SMEs). Automatic notification of alarms are sent via email or SMS to predetermined people, such as the facility manager at the site and the service providers. The reporting will be done along with the work order, which will be prepared after completion of incident based diagnostics to identify the cause.
- Exception Reporting - automatic energy alarms distributed by report, email or SMS text message.
- Failure Reports - include anomalies such as trip, fault, alarm status etc. Indicators such as the total number of failures, downtime, Mean Time Between Failures (MTBF) and Mean Time Between Repairs (MTBR) will be presented for each system for a given time range. These reports are prepared after a detailed study of failure incidents and can be generated monthly.
- Equipment (Asset) Management - with the support of SMEs. This helps to maintain a complete record of all assets, as well as any related maintenance. It is also possible to enter and track important warranty information, along with the location and history of company assets.
- Preventive Maintenance Work Order Creation - maintains a complete plan for scheduled maintenance on individual assets. Work orders will be accompanied by instructions on how to carry out the work, any safety instructions and knowledge documents, if required.
- Demand Maintenance Work Order Creation - work orders will be generated in response to service requests, emergency situations and incidents. They will also be accompanied by instructions on maintenance and safety, as well as knowledge documents, if required.
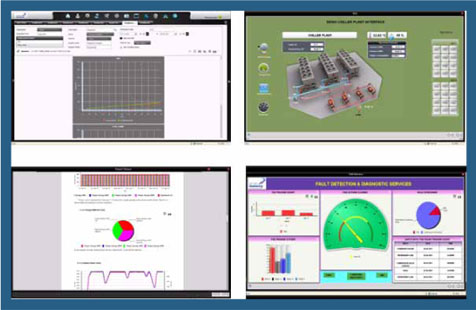
Dashboards and Reports Provide Key HVAC Information

There are a number of monthly reports available by default. These are available online and can be automatically sent by email as portable document format (PDF) files. They include:
- Demand per installed meter– maximum and average
- Individual air handling system specific power (kW/cfm) vs outside air temperature
- Lighting kW consumption vs illumination level by floor
- Daily kWh consumption for individual systems
- Chiller plant Delta T vs outside air temperature
- Boiler plant Delta T vs outside air temperature
- Chilled water kW/ton for individual chillers
- Chilled water kW/ton vs outside air temperature per plant
- Run hour vs kWh consumption report for individual equipment
- Average temperature by floor
- Average humidity by floor
- Average CO2 consumption report by floor
- Kilowatts per installed meter
- Average CO2 vs occupancy for a whole building
- Monthly information summary – defined to meet the needs of each client.
Dashboards will be set up for different types of user, showing the energy profile of the building. Typically the system will be monitoring electricity and natural gas use for each building by time of day, facilitating management of peak loads and identification of unnecessary equipment operation during unoccupied periods. It also enables monitoring of power quality supplied to the building and the power factor of the building load. The energy dashboard is the portal to access the building energy profile and provides the following parameters.
Energy use parameters for electricity, gas, and oil if a diesel generator is installed:
- kWh/m2/year
- kWh/HDD
- kWh/occupant/year
- Cooling kWh/CDD
- Heating kWh/HDD
- kWh/envelope surface area
- Minimum and maximum load factors
- Diversity factors.
Environmental impact parameters:
- GHG emission/carbon credits cumulative for electricity, gas and oil.
Climate parameters:
- Maximum temperature of the day
- Minimum temperature of the day
- Peak average temperature of the week
- Min average temperature of the week
- Solar insolation level.
They can offer predictive maintenance services based on detailed monitoring of condition and sophisticated data mining and analytics that enhance the standard preventative maintenance approach. This can identify potential problems in advance and arrange appropriate intervention. A detailed root cause analysis will identify the solution and the findings are used to issue a job card or work order. The system will automatically carry out hazard identification, risk assessment and risk control analysis. It can also remove the need for unnecessary maintenance of plant that is performing well, thus removing one of the causes of plant failure. This will give customers peace of mind that HVAC systems are operating reliably, with little or no downtime. They can also offer services to reduce GHG emissions and improve energy efficiency.
Benefits for Building Owners
Building owners gain in running their HVAC systems efficiently and in improving the sustainability of their facility. Cooling generally constitutes about 60% of the total energy load of the building, so tracking the chilled water system and managing its efficiency pays off and brings large savings with little investment. They can keep equipment running at peak efficiency and eliminate failures.
Benefits for HVAC Equipment Manufacturers
Using Pacific Controls Managed Services for Critical Assets Monitoring, chiller and other HVAC equipment manufacturers can offer their customers monitoring and management services through a single interface that connects all the equipment they have deployed. This allows them to have an on-going relationship with equipment users and provides a central data depository for analysis that will enhance R&D.

