Network Operation Center (NOC)
Pacific Controls’ Network Operation Center (NOC) monitors the datacenter infrastructure for critical alarms or conditions requiring special attention in order to avoid impact on performance. The NOC is capable of analyzing problems, performing troubleshooting, communicating with required skillsets and tracking problems until they are resolved.
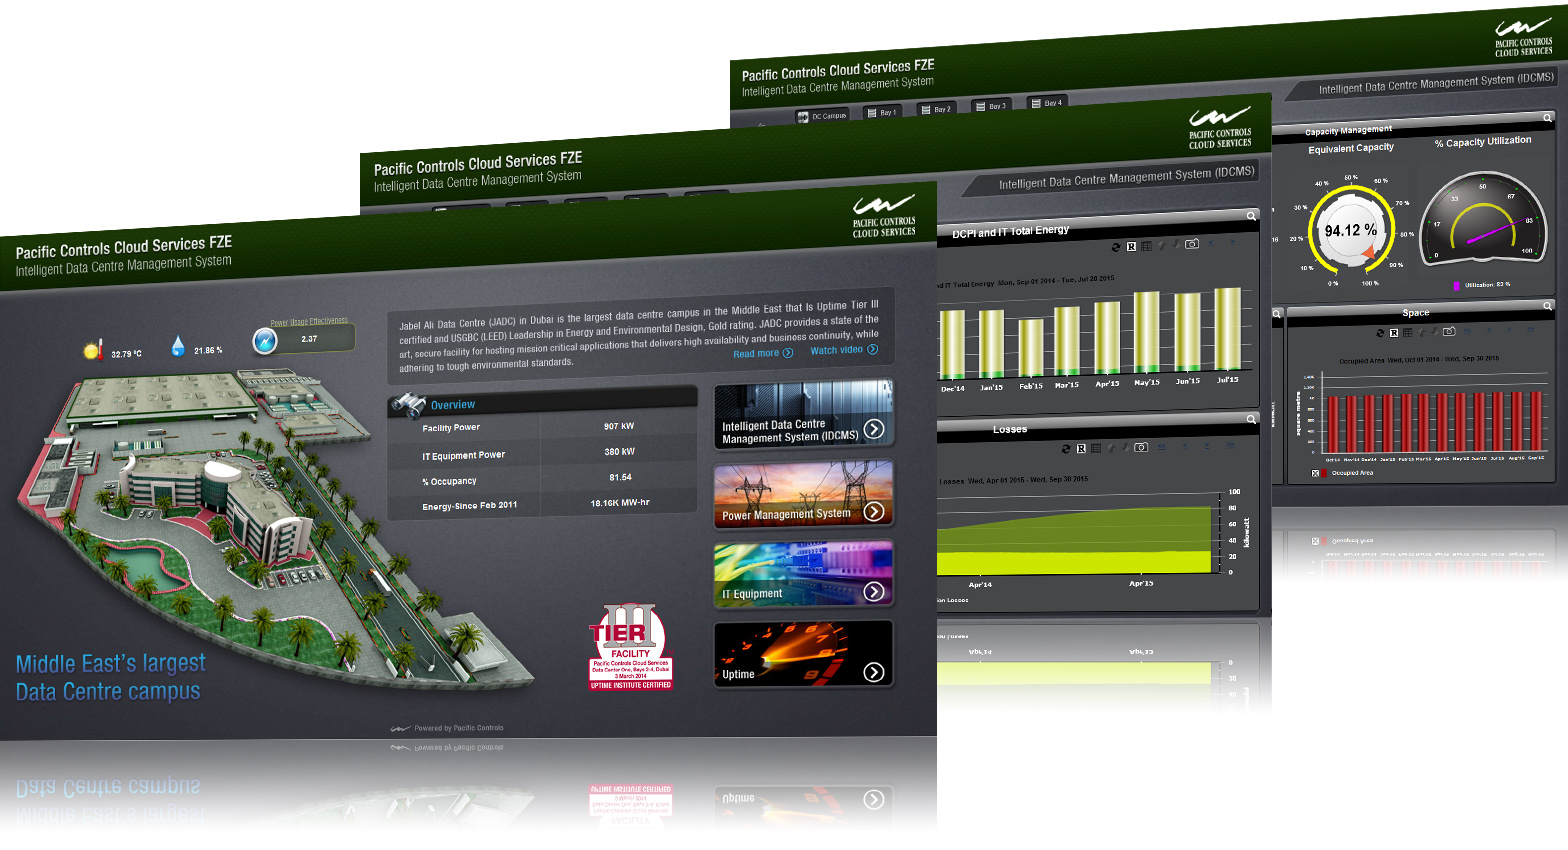
The NOC is the heart of Pacific Controls datacenter and is run round the clock with absolute adherence to SLAs, maintaining KPIs within acceptable range, ensuring zero downtime of infrastructure assets and their optimized performance, using state of the art Galaxy platform. In order to perform the NOC operations, Galaxy has been utilized to provide DCIM (Data Center Infrastructure Monitoring) functionalities addressing most of the Datacenter operatins needs.
The varied functionalities of DCIm are listed below.

Real-time monitoring
The DCIM integrates to the electrical, mechanical and other ELV assets real-time to give a holistic approach towards optimizing data centre operations at the NOC. It monitors and controls the building mechanical, electrical power and cooling equipment. It also provides seamless integration between the facility and processes. The operators in the NOC have full visibility of all the equipment in the data centre and manage all the elements in real time.

Reporting
The DCIM ensures the right information gets to the right people at the right time. It incorporates a full range of advanced analytics and presents the results in a variety of forms including: alarm messaging, graphing of historical data to show trends, dashboards and reports that are customised for each type of usage.

Capacity planning
The DCIM ensures that capacity is managed effectively. Data centres operate most efficiently when they maximise the use of key resources, particularly power and cooling. The DCIM stores the data on resource consumption and analyses growth patterns, allowing the data centre managers to accurately predict future demand patterns. This proactive approach ensures capacity expansion matches the data centre customers’ needs.

Integration and automation
The DCIM goes beyond just reducing consumption and lowering costs. It enables increased productivity while improving the facility’s flexibility and reliability. The DCIM can quickly signal problems and opportunities that otherwise may not be identified by nonintegrated management systems.
It captures overall efficiency in matrices that measure the utilisation of assets throughout the data centre. These matrices highlight anomalies that might otherwise be overlooked and include a range of Key Performance Indicators (KPIs) for cooling and power capacity and utilisation.
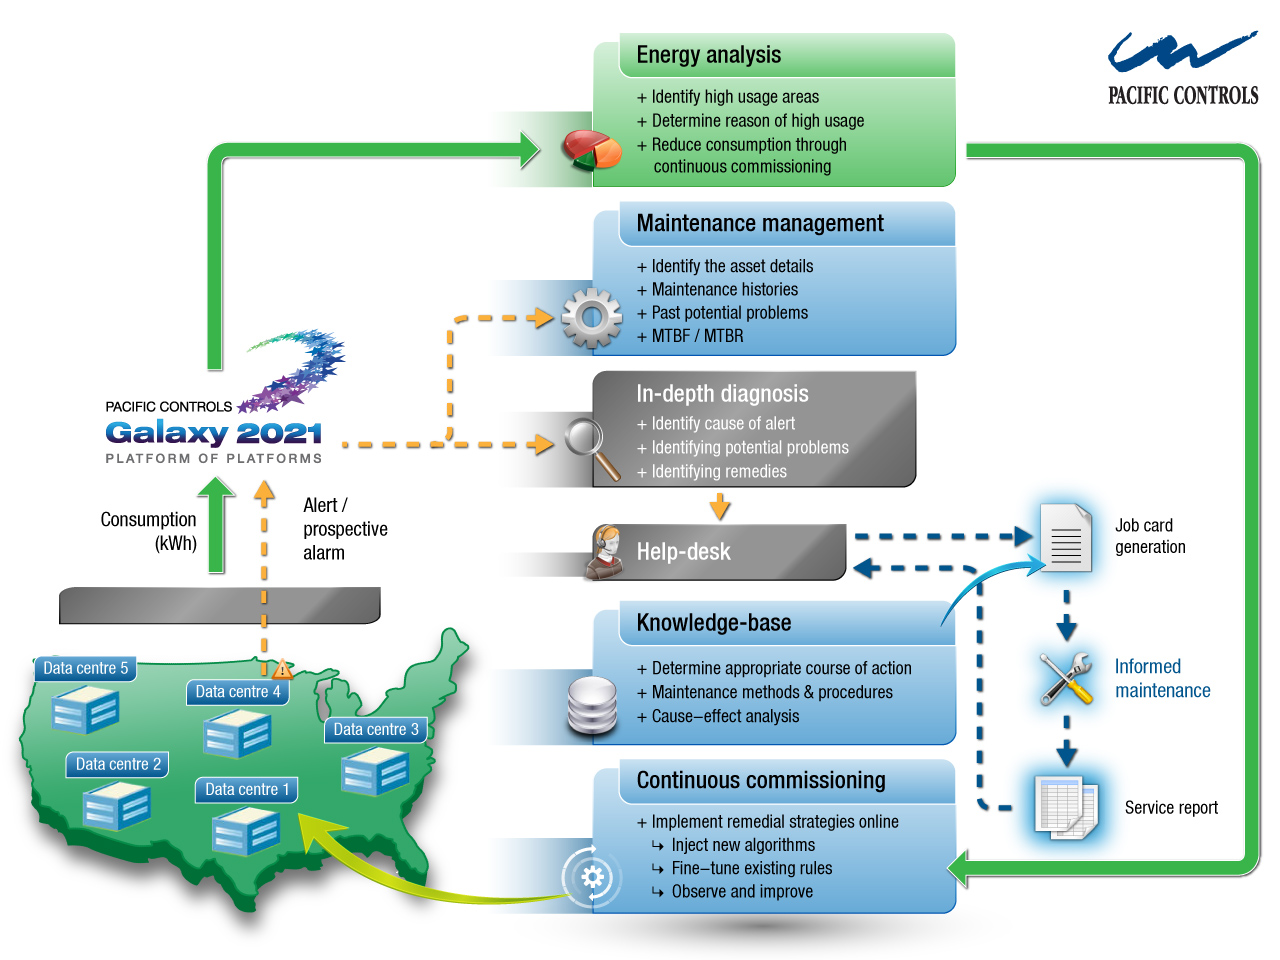
Energy management
NOC uses Pacific Controls’ world-leading energy management services to ensure that the facility has the smallest possible carbon footprint. NOC is staffed with highly qualified energy experts. Its energy monitoring and analysis tools utilise a compendium of technologies, innovative software and communication infrastructure.
Energy use and related operational data are monitored in real time, logged, archived and communicated over data networks to the NOC in the data centre. The software at the NOC generates a wide range of reports, designed to meet the needs of the data centre operation and management team and their customers.
This state-of-the-art energy management suite has five components:

Measurement and verification
The measurement and verification module serves as the base for the other data centre management components. It offers real-time, verified statistics necessary for assessing the energy and power efficiency of the data centre and its supporting infrastructure.

Energy analysis
The energy analysis component proactively logs and archives the energy consumption of the different components at predetermined intervals. The archived information is then analysed by the software to provide the data centre manager with an energy profile for each separate component, each aisle and the facility as a whole.

Carbon footprint analysis
This module tracks the total amount of CO2 released by the data centre and provides statistics on the overall carbon footprint on a periodic basis. This is used to formulate strategies for mitigating the carbon footprint of the computing infrastructure.

Continuous commissioning
Continuous commissioning is a process of fine-tuning the operation of the HVAC equipment. Any environmental and operational problems are rectified by Gbots that intelligently and automatically, adjust control settings and actuators.

Fault detection and diagnosis
Fault detection and diagnosis is one of the most important tools in the data centre management toolbox. Pacific Controls has developed an advanced fault detection system using intelligent Gbots, autonomous software robots deployed across networks that are capable of identifying even minor issues in the data centre facility. In some cases the Gbots can rectify the problem themselves and, if not, the software generates work orders for resolving the issues detected. The graphic referenced in figure 2 summarises the deployment of these five strategic services which are explained in detail in the following section.
- Intuitive: the meaning is clear, just from the name
- Simple as possible, without glossing over important details
- Scientifically accurate and precise
- Granular enough that individual aspects can be analysed in manageable chunks then assigned to specific parties for improvement
- Nested together elegantly, so the overall equation for data centre power or energy use is simple
- Able to easily calculate how much of a data centre’s power, or energy, is wasted by a particular practice, process, or configuration
- Sufficiently flexible to respond to new technology developments
- Able to clearly distinguish between power and energy
- Devoid of ambiguous terms
- Vendor-neutral, without hindering vendor-dependent R&D innovation.
Power usage effectivness
The leading metric used to show how efficiently data centers are using enmergy, the Power Usage Effectiveness (PUE) figure, is a ratio of how much energy consumption is going to run a data center’s IT and servers vs how much energy is going to run the overall data center. If a lot of the data center’s energy is used for cooling and power conversion, the energy use isn’t very efficient, and the data center will have a PUE closer to two. If very little of a data center’s energy is used for cooling and power conversion (and is instead mostly being used to power its servers), a data center is using energy much more efficiently and will have a PUE closer to one.
“Total facility power” in this equation is the power required to operate the entire data center, including servers, IT equipment, lighting, cooling, air movement, etc. “IT equipment power” represents the power required to operate the servers and IT equipment alone.
Data Center infrastructure effectiveness
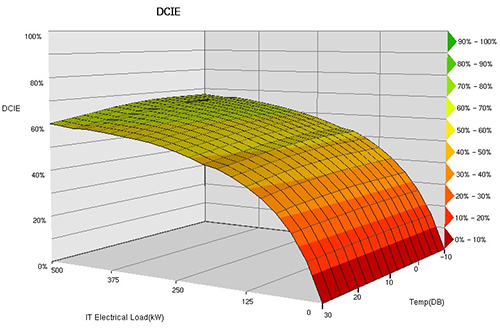
The reciprocal of PUE expressed as a percentage is known as the Data Centre infrastructure Efficiency – DciE. DCiE is one measure of the energy efficiency of a data center. DCiE is calculated by dividing the ICT equipment power by the total facility power. Is it an instantaneous metric (i.e. it varies continually based on current conditions), but can be timeaveraged to show overall trends for reporting purposes. This is a rather simple metric and is not particularly useful for informed decision making, but it is widely known and discussed, and is the closest to a standard” that exists currently. For that reason alone, it must be included.
Other KPIs available to the SMEs in the NOC include:
- Power Usage Effectiveness (PUE)
- Data Centre Infrastructure Efficiency (DCiE)
- Rack Cooling Index (RCI)
- HVAC Effectiveness
- Power Density
- Return Temperature Index
- Data Center Cooling System Efficiency
- Cooling System Sizing Factor
- Airflow Efficiency
- UPS Load Factor
- Data Center UPS System Efficiency
- Data Center Lighting Power Density
- Asset Ranking
Some of the advanced metrics used are:
- Carbon Intensity Per Unit of Data
- Deployed Hardware Utilisation Efficiency(DH-UE)
- Free Cooling Metric
- The Data Center Energy Productivity (DceP)
- Weighted CPU utilisation
Power systems monitoring
All the systems in the data centre are continuously monitored and pro-actively maintained to make failures extremely rare. Pacific Controls solution monitors power quality and consumption at each and every level, as described below:
- Level 1: Utility Power - The utility and transformer output power are measured and monitored. This provides a clear indication of transformer efficiency and loss, and also provides a baseline figure for power delivered to the building.
- Level 2: Cooling and Lighting: The power consumed by cooling equipment – including chillers, air handlers and closely coupled cooling equipment alongside the racks – is measured to understand consumption patterns.
- Level 3: Power Systems: The power input into the protected power distribution UPS systems and corresponding outputs are measured through digital sensors and integration with the UPS management system. This provides key efficiency and consumption figures at server, rack, room, floor and building level. Multiprotocol engines provide several key functions such as regular data logging, alarm notification, and enforcement of use cases and controls. Logging activities are, in all cases, redundant in case of any single failure.
In the NOC, the data is logged and archived. Intelligent algorithms programmed by the SMEs analyse the data and auto populate the preventive maintenance report, which helps to prevent unexpected downtime.
The applications continuously benchmark infrastructure performance, helping to ensure that desired PUE and other metrics are met.
Bus bar and switchgear monitoring
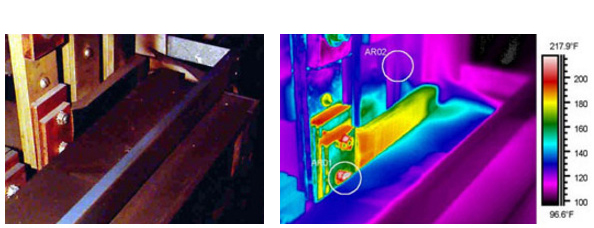
Infrared point sensors and thermal imaging cameras are used to provide safe non-contact measurement of real-time bus bar temperatures. This provides both instantaneous alarms for faults in the switchgear cabinet and trend analysis for predictive maintenance, which prolongs the life and efficiency of the equipment and minimises shutdowns. The NOC has real time information about the state of both live and redundant electricity delivery paths, and uses this information to notify the operators about any anomalies.
Uninterrupted power supply systems
The UPS Systems are monitored in real time by integrating their controllers with the IP systems. Data is logged and archived in the NOC and analysed against the designed energy efficiency and power quality. Performance is continuously predicted from real-time data and any sign of a problem developing will raise an alarm, minimizing the chance of an unplanned shutdown.
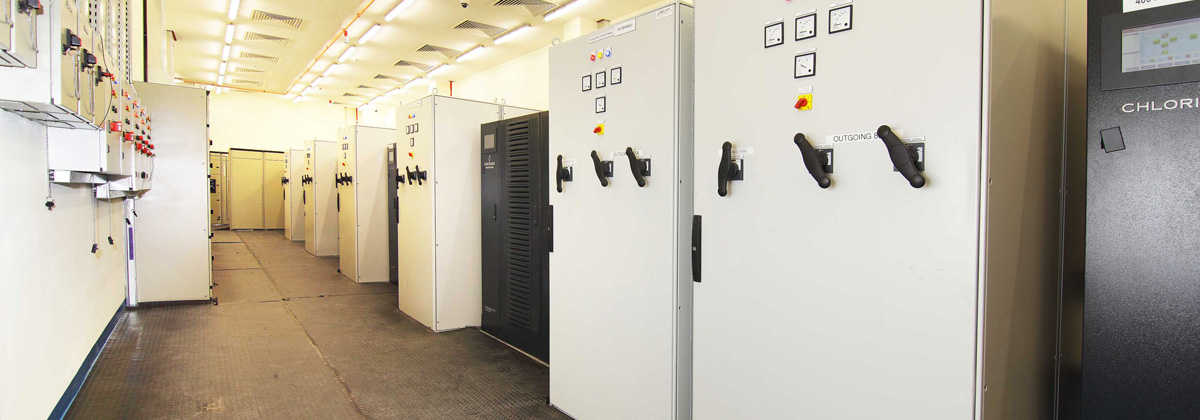
Power distribution units PDUs and the status of individual breakers are also monitored in real time by integrating their controllers with the IP systems and the NOC. This makes it possible to load power supplies more efficiently, dynamically keep track of alarms and ensure continuous power supply to the servers. The NOC monitors the pattern of breaker load against the allocated load for a particular customer. Pacific Controls notifies customers about any excess over the mutually agreed load and auto generates bills accordingly.
DC power plant Rectifiers and Battery Monitoring System - Similarly the rectifiers and supervisory controllers of the DC power plant are integrated with the DCMS and the data mined to identify patterns in various critical monitoring and management parameters. The NOC compares these with benchmarks to raise alarms about potential problems.
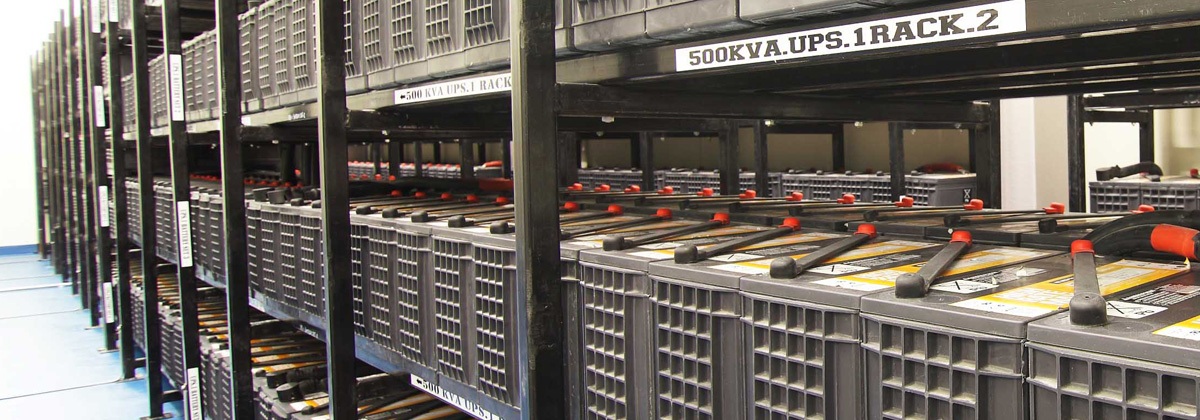
Battery monitoring ensures that backup power is ready in case of an unexpected power failure. The DCMS monitors battery conditions cell-by-cell, including cell voltage, cell resistance, string current, and temperature. If any parameter is approaching a defined threshold an alarm is raised at the NOC. This predictive approach ensures almost zero downtime and efficient battery maintenance and replacement.
Generators and fuel tanks
Generators provide essential back-up power and must be continuously monitored to ensure that they will start when needed. The DCMS schedules regular test runs and monitors engine operations to detect pre-alarms or failures using Gbots. The diesel storage tanks are continuously monitored, including rate of change of fuel level, to detect leaks and theft and prevent environmental pollution from spills. The refuelling date and time is notified to the maintenance teams ahead of time. All electrical and operational parameters are monitored in real time to maximise efficiency. Pre-emptive maintenance ensures generator availability and a rapid response to service problems.

Monitoring of chiller plant and associated equipment
We install our own multi protocol control engine to monitor and manage the chiller plant in the Data Center. The multi protocol control engine enables connectivity to the chillers, pump starter panels, VFD etc via industry standard open and legacy protocols.
The sequence of operation will reside on the multi protocol control engine, which will work as a standalone chiller plant manager with its associated IO controllers. Pacific Controls IO modules, which reside in the field layer, communicate to the Multi protocol control engine. The IO modules are equipped with status LEDs and Override switches for in case of a manual operation or for testing purposes. The status LEDs will give the BMS operator a clear idea of the command from BMS and the feed back from the end device. Any mismatch will also be reflected in the IO modules. The IO controllers are capable of handling any mismatch commands in case of a communication failure wherein it will hold the last commands from the multi protocol control engine, and still keep the critical equipments running till the communication path is restored.
Data centers are so designed that all the critical elements and their delivery paths are made redundant. These designs also help the operators for maintenance in the critical elements or its delivery path on a planned basis. Pacific Controls has the expertise and experience in programming, sequencing and controlling the chiller plant in such a way that it complies with the design sequence of operation. Pacific Controls software delivery platform, Galaxy, ensures that your chiller plant works as per the design Sequence of Operation (SOP), and still gives the maximum efficiency during its lifetime. BTU meters are strategically placed on chilled water delivery paths, which benefits you in measuring the total chilled water consumption, flow rate of chilled water through each header and calculates the Thermal Energy.

Ancillary monitoring systems
Aisle Monitoring, white space and grey area - The DCMS monitors environmental parameters outside the racks, in the white space and grey areas of the data centre. The hot aisle/cold aisle configuration is created to prevent the mixing of the hot rack exhaust air and the cool supply air drawn in to the racks. Temperature, humidity and flow sensors placed below the raised floors, inside the cold aisles and above the rack provide precise data on the temperature profile. In addition, sensors for dust, nitrogen, oxygen and CO2 levels are monitored in real time to ensure that perfect working conditions are maintained both for people and machines. The rate of change of concentration is captured and alarms generated when they are about to deviate from defined limits.
Thermal imaging cameras - The DCMS uses thermal imaging cameras to identify potentially serious equipment flaws often invisible to the naked eye. The NOC performs regular thermal imaging audits to identify equipment problems in the early stages and take prompt remedial action before costly system failures occur. The audit highlights areas where temperature and humidity levels exceed tolerances and might compromise network reliability.
It allows the JADC managers to identify where to install perforated panels to improve circulation or blanking plates to keep hot air from entering empty slots on unfilled racks. These strategies help keep servers cool enough to maintain their warranties. The periodic thermal audit allows the NOC to build a detailed condition history of the equipment and tailor a maintenance schedule and reports to customer requirements. The thermal imager is useful for monitoring power strips and power supplies built into the racks as well as wiring connections, plugs and plug strips. Loose connections and loose or bent plugs cause overheating. A thermal scan can also detect broken cords and broken conductors in wires.
Water leak detection - Water damage poses a very real risk. The JADC has leak detectors below the raised floor where the chiller water pipes run. These are monitored in real time by the DCMS so that the slightest leak is immediately repaired.
Rodent repellent systems - The DCMS has integrated rodent repellent systems to ensure that there is no damage from vermin.
Very early smoke detection apparatus - The early fire detection systems are monitored in real time by the DCMS, taking samples for regular analysis of air in the data centre to detect the slightest trace of smoke.

www.EnjoyCloud.ae. Chat
with our representative to
answer all your queries now


